Bootstrapping linear models
TODO
- GLM example
- link to resamplingBoot
Install required packages
wants <- c("boot")
has   <- wants %in% rownames(installed.packages())
if(any(!has)) install.packages(wants[!has])
Regression parameters: Case resampling
set.seed(123)
N  <- 100
X1 <- rnorm(N, 175, 7)
X2 <- rnorm(N,  30, 8)
X3 <- abs(rnorm(N, 60, 30))
Y  <- 0.5*X1 - 0.3*X2 - 0.4*X3 + 10 + rnorm(N, 0, 3)
dfRegr <- data.frame(X1, X2, X3, Y)
(fit <- lm(Y ~ X1 + X2 + X3, data=dfRegr))
Call:
lm(formula = Y ~ X1 + X2 + X3, data = dfRegr)

Coefficients:
(Intercept)           X1           X2           X3
13.9252 0.4762 -0.2827 -0.4057 sqrt(diag(vcov(fit)))(Intercept) X1 X2 X3
9.05357721 0.05008996 0.04104598 0.01122308 confint(fit) 2.5 % 97.5 %
(Intercept) -4.0460232 31.8963943
X1 0.3768077 0.5756632
X2 -0.3641438 -0.2011926
X3 -0.4280163 -0.3834611getRegr <- function(dat, idx) {
bsFit <- lm(Y ~ X1 + X2 + X3, subset=idx, data=dat)
coef(bsFit)
}library(boot)
nR <- 999
(bsRegr <- boot(dfRegr, statistic=getRegr, R=nR))
ORDINARY NONPARAMETRIC BOOTSTRAP


Call:
boot(data = dfRegr, statistic = getRegr, R = nR)


Bootstrap Statistics :
      original        bias    std. error
t1* 13.9251855  0.0965488381  8.00579816
t2*  0.4762354 -0.0003379187  0.04459103
t3* -0.2826682 -0.0007962273  0.03970876
t4* -0.4057387 -0.0003034646 0.01168983boot.ci(bsRegr, conf=0.95, type="bca", index=1)$bca conf
[1,] 0.95 16.47 964.1 -3.211747 28.48014boot.ci(bsRegr, conf=0.95, type="bca", index=2)$bca conf
[1,] 0.95 32.58 981.51 0.3918115 0.568677boot.ci(bsRegr, conf=0.95, type="bca", index=3)$bca conf
[1,] 0.95 20.67 969.91 -0.3723436 -0.2112341boot.ci(bsRegr, conf=0.95, type="bca", index=4)$bca conf
[1,] 0.95 23.16 973.1 -0.4292687 -0.3836797ANOVA
Model-based resampling
Under the null hypothesis
P     <- 4
Nj    <- c(41, 37, 42, 40)
muJ   <- rep(c(-1, 0, 1, 2), Nj)
dfCRp <- data.frame(IV=factor(rep(LETTERS[1:P], Nj)),
                    DV=rnorm(sum(Nj), muJ, 6))
anBase <- anova(lm(DV ~ IV, data=dfCRp))
Fbase <- anBase["IV", "F value"]
(pBase <- anBase["IV", "Pr(>F)"])[1] 0.218359fit0 <- lm(DV ~ 1, data=dfCRp) ## fit 0-model
E <- residuals(fit0) ## residuals
Er <- E / sqrt(1-hatvalues(fit0)) ## rescaled residuals
Yhat <- fitted(fit0) ## prediction
getAnova <- function(dat, idx) {
Ystar <- Yhat + Er[idx]
anBS <- anova(lm(Ystar ~ IV, data=dat))
anBS["IV", "F value"]
}
library(boot)
nR <- 999
(bsAnova <- boot(dfCRp, statistic=getAnova, R=nR))
ORDINARY NONPARAMETRIC BOOTSTRAP


Call:
boot(data = dfCRp, statistic = getAnova, R = nR)


Bootstrap Statistics :
    original     bias    std. error
t1* 1.493977 -0.4779045   0.8281859
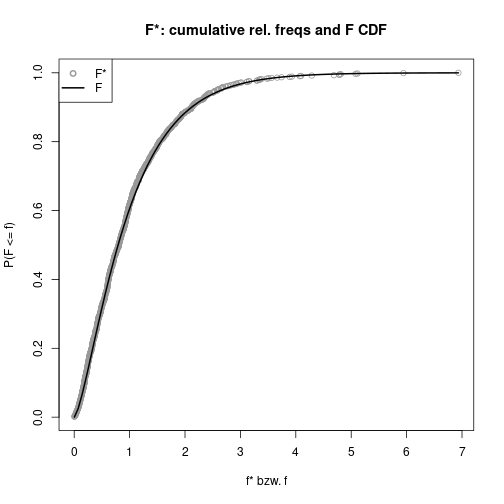
Fstar <- bsAnova$t
# don't use >= because of floating point arithmetic problems
tol <- .Machine$double.eps^0.5
FsIsGEQ <- (Fstar > Fbase) | (abs(Fstar-Fbase) < tol)
(pValBS <- (sum(FsIsGEQ) + 1) / (length(Fstar) + 1))[1] 0.215plot(Fstar, ecdf(Fstar)(Fstar), col="gray60", pch=1, xlab="f* bzw. f",
ylab="P(F <= f)", main="F*: cumulative rel. freqs and F CDF")
curve(pf(x, P-1, sum(Nj) - P), lwd=2, add=TRUE)
legend(x="topleft", lty=c(NA, 1), pch=c(1, NA), lwd=c(2, 2),
col=c("gray60", "black"), legend=c("F*", "F"))
Wild boostrap
Under the null hypothesis
getAnovaWild <- function(dat, idx) {
    n  <- length(idx)                     ## size of replication
    ## 1st choice for random variate U: Rademacher-variables
    Ur <- sample(c(-1, 1), size=n, replace=TRUE, prob=c(0.5, 0.5))

    ## 2nd option for choosing random variate U
    Uf <- sample(c(-(sqrt(5) - 1)/2, (sqrt(5) + 1)/2), size=n, replace=TRUE,
                 prob=c((sqrt(5) + 1)/(2*sqrt(5)), (sqrt(5) - 1)/(2*sqrt(5))))

    Ystar <- Yhat + (Er*Ur)[idx]          ## for E* with Rademacher-variables
    # Ystar <- Yhat + (Er*Uf)[idx]        ## for E* with 2nd option
    anBS  <- anova(lm(Ystar ~ IV, data=dat))
    anBS["IV", "F value"]
}library(boot)
nR <- 999
bsAnovaW <- boot(dfCRp, statistic=getAnovaWild, R=nR)
FstarW <- bsAnovaW$t
# don't use >= because of floating point arithmetic problems
tol <- .Machine$double.eps^0.5
FsIsGEQ <- (FstarW > Fbase) | (abs(FstarW-Fbase) < tol)
(pValBSw <- (sum(FsIsGEQ) + 1) / (length(FstarW) + 1))[1] 0.211Detach (automatically) loaded packages (if possible)
try(detach(package:boot))Get the article source from GitHub
R markdown - markdown - R code - all posts