Diagram types with the ggplot2 package
Install required packages
ggplot2, ggbeeswarm, cowplot, patchwork
wants <- c("ggplot2", "ggbeeswarm", "cowplot", "patchwork")
has   <- wants %in% rownames(installed.packages())
if(any(!has)) install.packages(wants[!has])
Simulate data
Njk    <- 50
P      <- 4
Q      <- 2
IQ     <- rnorm(P*Q*Njk, mean=100, sd=15)
height <- rnorm(P*Q*Njk, mean=175, sd=7)
rating <- factor(sample(LETTERS[1:3], Njk*P*Q, replace=TRUE))
sex    <- factor(rep(c("f", "m"), times=P*Njk))
group  <- factor(rep(c("control", "placebo", "treatA", "treatB"), each=Q*Njk))
sgComb <- interaction(sex, group)
mood   <- round(rnorm(P*Q*Njk, mean=c(85, 80, 110, 90, 130, 100, 93, 121)[sgComb], sd=25))
myDf   <- data.frame(sex, group, sgComb, IQ, height, rating, mood)
Diagram types
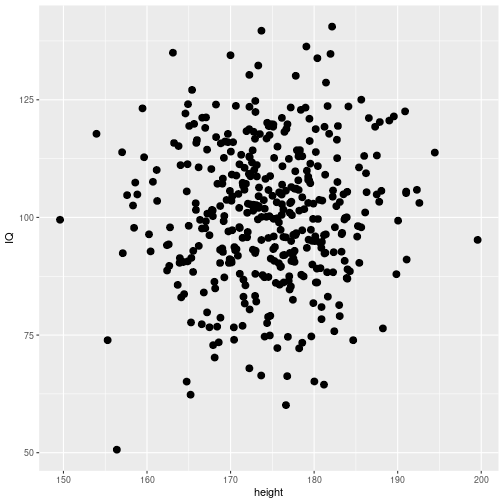
Scatterplot
Line plot
group=TRUE is necessary here
    group   mood
1 control  86.79
2 placebo 104.29
3  treatA 114.53
4  treatB 105.14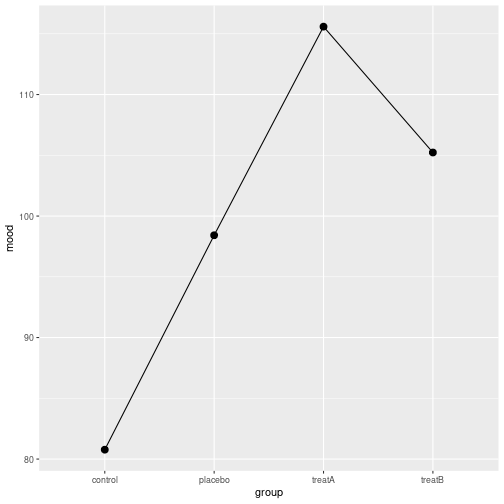
    group   mood
1 control  86.79
2 placebo 104.29
3  treatA 114.53
4  treatB 105.14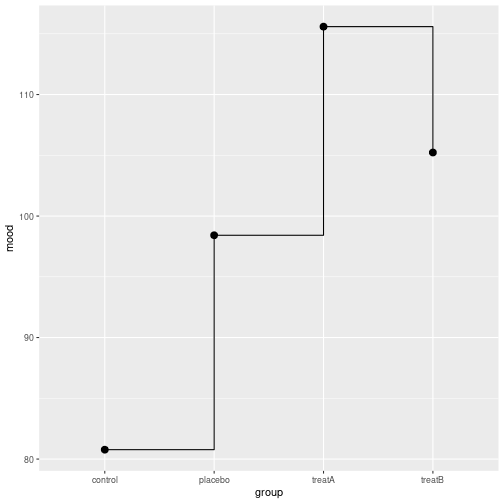
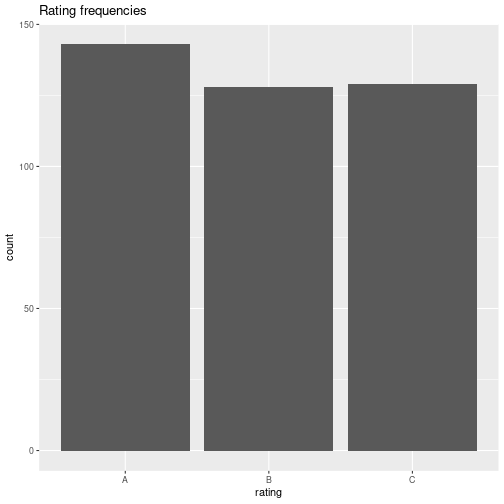
Barplot
Absolute frequencies
Relative frequencies
ggplot(myDf, aes(x=rating)) +
    geom_bar(stat="count",
             aes(y=(..count..) / sum(..count..))) +
        ggtitle("Relative rating frequencies")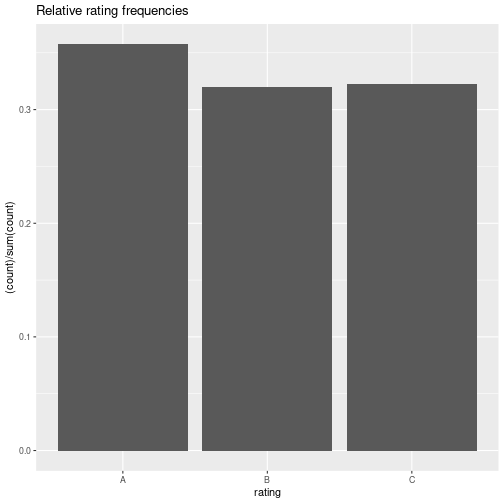
Histogram
Absolute frequencies
ggplot(myDf, aes(x=IQ)) +
        geom_histogram(bins=20) +
        ggtitle("Histogram IQ by group") +
        theme(legend.position="none")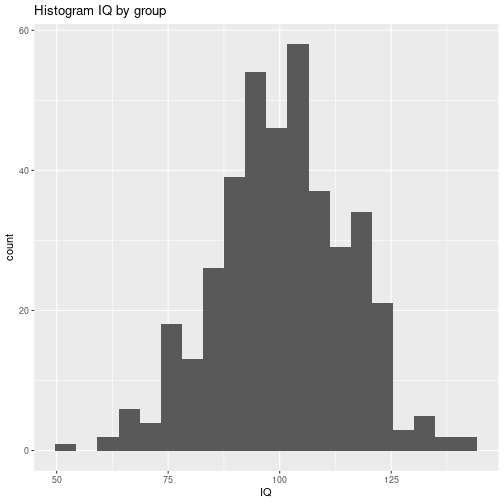
Density with nonparametric kernel density estimator
ggplot(myDf, aes(x=mood)) +
    geom_histogram(aes(y=..density..)) +
    ggtitle("Histogram mood by group") +
    geom_density(color="darkgrey", fill="grey", alpha=0.6)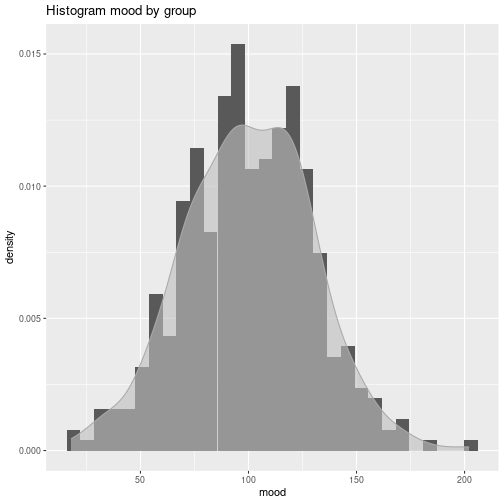
Boxplot
Add a geom_beeswarm() layer to show raw data.
library(ggbeeswarm)
ggplot(myDf, aes(x=sex, y=height)) +
    geom_boxplot(outlier.shape=NULL) +
    geom_beeswarm(alpha=0.5) +
    ggtitle("Height by sex") +
    theme(legend.position="none")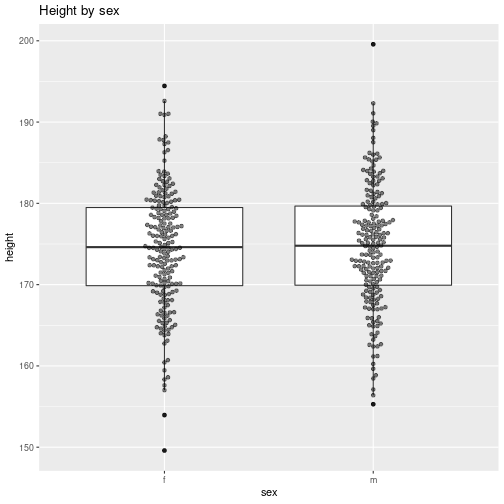
Q-Q plot
Against normal distribution
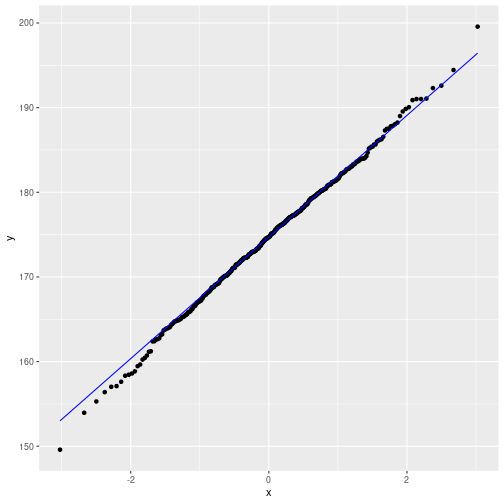
Against pre-specified distribution (here: t)
parL <- list(df=10, ncp=0)
ggplot(myDf, aes(sample=height)) +
    geom_qq(distribution=qt, dparams=parL) +
    geom_qq_line(color="blue", distribution=qt, dparams=parL)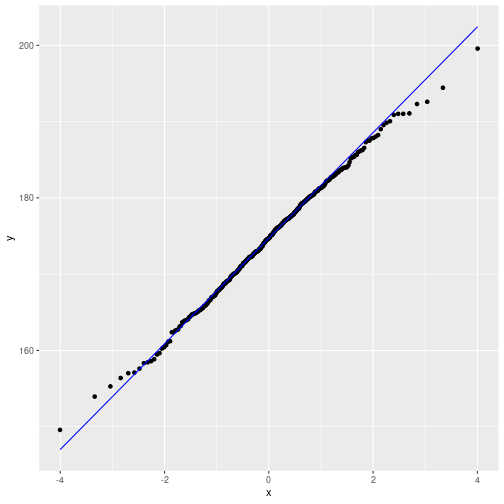
Compare quantiles of two variables
probs <- ppoints(50)
qDat  <- data.frame(qmood=quantile(myDf$mood, probs),
                    qheight=quantile(myDf$height, probs))

ggplot(qDat, aes(x=qmood, y=qheight)) +
    geom_point() +
    xlab("Quantiles mood") +
    ylab("Quantiles height")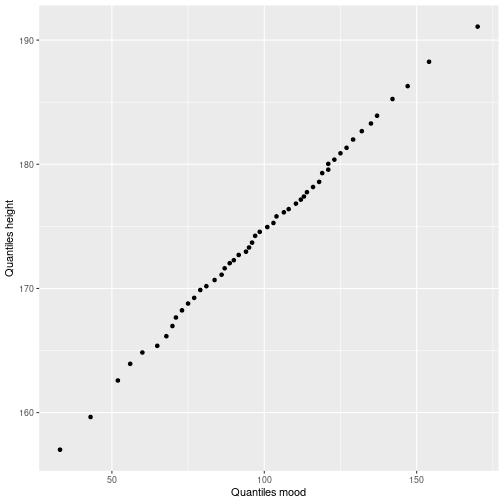
Multi-panel plots
Split the diagram into panels by column using facet_grid().
ggplot(myDf, aes(x=rating, y=IQ)) +
        geom_point(size=3) +
        facet_grid(. ~ group) +
        ggtitle("IQ ~ height split by sex and group") +
        guides(shape="none")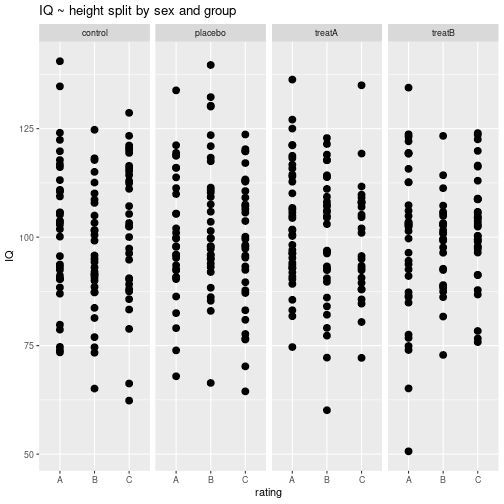
Split the diagram into matrix of panels using facet_wrap(). Option scales="free_y" produces separate y-axis for each panel.
ggplot(myDf, aes(x=rating, y=IQ)) +
        geom_point(size=3) +
        facet_wrap(. ~ group, scales="free_y") +
        ggtitle("IQ ~ height split by sex and group") +
        guides(shape="none")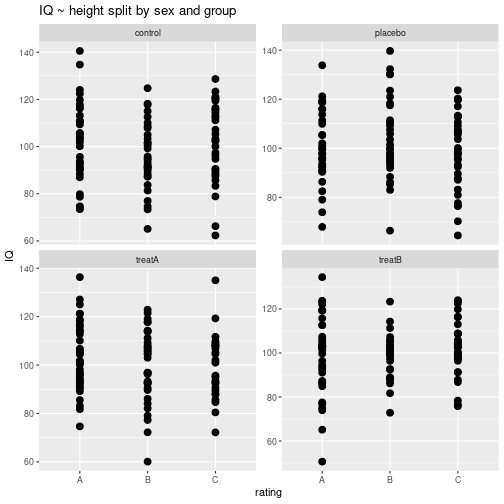
Additional diagram elements
Add error bars
groupN     <- as.data.frame(xtabs(~ sex + group, data=myDf))
groupM     <- aggregate(mood ~ sex + group, data=myDf, FUN=mean)
groupSD    <- aggregate(mood ~ sex + group, data=myDf, FUN=sd)
groupMSD   <- merge(groupM, groupSD, by=c("sex", "group"), suffixes=c(".M", ".SD"))
groupMSDN  <- merge(groupMSD, groupN, by=c("sex", "group"))
(groupMSDN <- transform(groupMSDN,
                        SEMlo=mood.M - mood.SD/sqrt(Freq),
                        SEMup=mood.M + mood.SD/sqrt(Freq)))
sex group mood.M mood.SD Freq SEMlo SEMup
1 f control 90.16 26.10916 50 86.46761 93.85239
2 f placebo 115.32 22.71064 50 112.10823 118.53177
3 f treatA 125.52 27.40791 50 121.64394 129.39606
4 f treatB 91.36 25.60035 50 87.73956 94.98044
5 m control 83.42 25.34826 50 79.83521 87.00479
6 m placebo 93.26 23.49452 50 89.93737 96.58263
7 m treatA 103.54 23.58416 50 100.20470 106.87530
8 m treatB 118.92 22.67772 50 115.71289 122.12711ggplot(groupMSDN, aes(x=group, y=mood.M, ymin=SEMlo, ymax=SEMup,
color=sex, shape=sex, group=sex)) +
geom_point() +
geom_line() +
geom_linerange()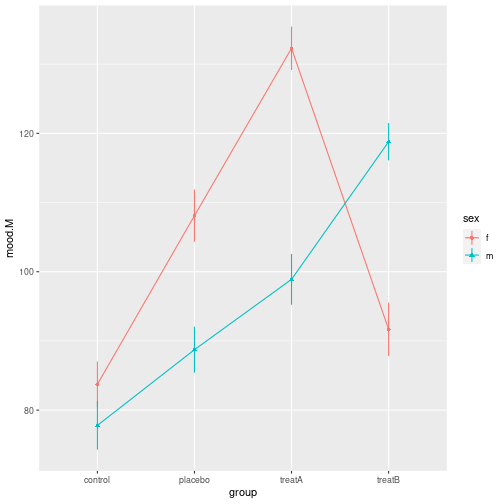
geom_hline()for a horizontal linegeom_vline()for a vertical linegeom_smooth()for a regression line including SEsgeom_text()for text from a variableggtitle()for a diagram titleannotate()for text given directly as an argument
ggplot(myDf, aes(x=height, y=IQ)) +
        geom_hline(aes(yintercept=100), linetype=2) +
        geom_vline(aes(xintercept=180), linetype=2) +
        geom_point(size=3) +
        geom_smooth(method=lm, se=TRUE, size=1.2, fullrange=TRUE) +
        facet_grid(sex ~ group) +
        ggtitle("IQ ~ height split by sex and group") +
        theme(legend.position="none") +
        geom_text(aes(x=190, y=70, label=sgComb)) +
        annotate("text", x=165, y=130, label="annotation")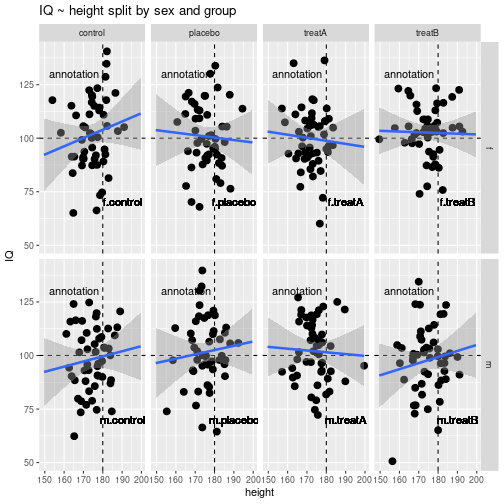
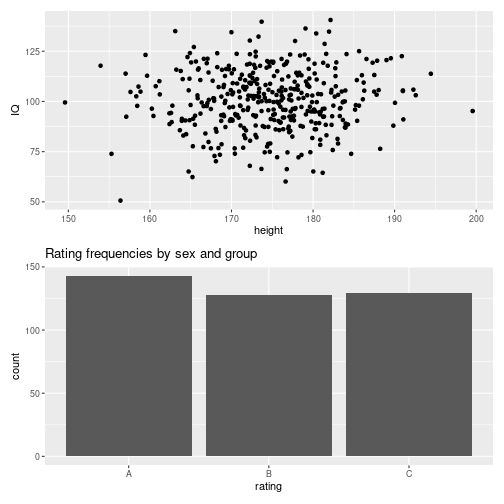
Put different plots on the same page
Using package cowplot
library(cowplot)
p1 <- ggplot(myDf, aes(x=height, y=IQ)) +
    geom_point()

p2 <- ggplot(myDf, aes(x=rating)) +
    geom_bar(stat="count", position=position_stack()) +
    ggtitle("Rating frequencies by sex and group")

plot_grid(p1, p2, ncol=1, align="v")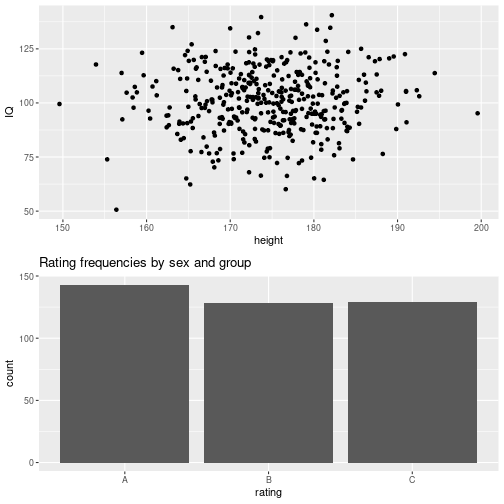
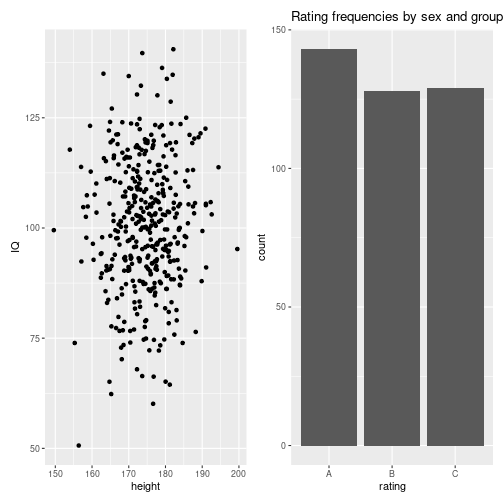
Using package patchwork
Save ggplot2 diagrams to file
Graphics file format is determined from file ending.
p <- ggplot(myDf, aes(x=height, y=IQ)) +
        geom_point(size=3)

ggsave(p, file="diag_ggplot.pdf", width=9, height=6, units="in")
ggsave(p, file="diag_ggplot.png", width=200, height=150, units="mm", dpi=300)
Further online resources
- See Cookbook for R:
ggplot2diagrams for many detailed examples ofggplot2diagrams. - Package
esquisseprovides an interactive Shiny app to create and customize ggplot2 diagrams.
Detach (automatically) loaded packages (if possible)
try(detach(package:cowplot))
try(detach(package:patchwork))
try(detach(package:ggbeeswarm))
try(detach(package:ggplot2))
Get the article source from GitHub
R markdown - markdown - R code - all posts