Exploratory factor analysis
Install required packages
wants <- c("GPArotation", "mvtnorm", "psych")
has   <- wants %in% rownames(installed.packages())
if(any(!has)) install.packages(wants[!has])
Factor analysis
Simulate data
True matrix of loadings
N <- 200
P <- 6
Q <- 2
(Lambda <- matrix(c(0.7,-0.4, 0.8,0, -0.2,0.9, -0.3,0.4, 0.3,0.7, -0.8,0.1),
                  nrow=P, ncol=Q, byrow=TRUE))
[,1] [,2]
[1,] 0.7 -0.4
[2,] 0.8 0.0
[3,] -0.2 0.9
[4,] -0.3 0.4
[5,] 0.3 0.7
[6,] -0.8 0.1Non correlated factors
set.seed(123)
library(mvtnorm)
Kf <- diag(Q)
mu <- c(5, 15)
FF <- rmvnorm(N, mean=mu,        sigma=Kf)
E  <- rmvnorm(N, mean=rep(0, P), sigma=diag(P))
X  <- FF %*% t(Lambda) + E
Using factanal()
(fa <- factanal(X, factors=2, scores="regression"))
Call:
factanal(x = X, factors = 2, scores = "regression")

Uniquenesses:
[1] 0.616 0.638 0.225 0.885 0.658 0.608

Loadings:
     Factor1 Factor2
[1,]  0.570  -0.243
[2,]  0.601
[3,] -0.217   0.853
[4,] -0.197   0.276
[5,]  0.327   0.486
[6,] -0.622

               Factor1 Factor2
SS loadings      1.267   1.104
Proportion Var   0.211   0.184
Cumulative Var   0.211   0.395

Test of the hypothesis that 2 factors are sufficient.
The chi square statistic is 1.43 on 4 degrees of freedom.
The p-value is 0.84
Using fa() from package psych with rotation
Rotation uses package GPArotation
library(psych)
corMat <- cor(X)
(faPC  <- fa(r=corMat, nfactors=2, n.obs=N, rotate="varimax"))
Factor Analysis using method = minres
Call: fa(r = corMat, nfactors = 2, n.obs = N, rotate = "varimax")
Standardized loadings (pattern matrix) based upon correlation matrix
MR2 MR1 h2 u2 com
1 0.57 -0.24 0.38 0.62 1.4
2 0.60 0.03 0.36 0.64 1.0
3 -0.22 0.85 0.77 0.23 1.1
4 -0.20 0.28 0.12 0.88 1.8
5 0.33 0.49 0.34 0.66 1.8
6 -0.62 0.07 0.39 0.61 1.0
MR2 MR1
SS loadings 1.27 1.10
Proportion Var 0.21 0.18
Cumulative Var 0.21 0.40
Proportion Explained 0.53 0.47
Cumulative Proportion 0.53 1.00
Mean item complexity = 1.3
Test of the hypothesis that 2 factors are sufficient.
The degrees of freedom for the null model are 15 and the objective function was 0.82 with Chi Square of 160.38
The degrees of freedom for the model are 4 and the objective function was 0.01
The root mean square of the residuals (RMSR) is 0.02
The df corrected root mean square of the residuals is 0.03
The harmonic number of observations is 200 with the empirical chi square 1.37 with prob < 0.85
The total number of observations was 200 with MLE Chi Square = 1.43 with prob < 0.84
Tucker Lewis Index of factoring reliability = 1.067
RMSEA index = 0 and the 90 % confidence intervals are NA 0.061
BIC = -19.77
Fit based upon off diagonal values = 1
Measures of factor score adequacy
MR2 MR1
Correlation of scores with factors 0.81 0.88
Multiple R square of scores with factors 0.66 0.78
Minimum correlation of possible factor scores 0.33 0.56Factor scores
bartlett <- fa$scores
head(bartlett)
Factor1 Factor2
[1,] -0.14692704 -0.4087124
[2,] 1.12204715 -0.1700198
[3,] 0.06506737 0.7206915
[4,] -0.11231953 0.1411704
[5,] -0.24712181 1.4317221
[6,] 1.09156957 0.3978757anderson <- factor.scores(x=X, f=faPC, method="Anderson")
head(anderson$scores) MR2 MR1
[1,] -0.2024948 -0.4723557
[2,] 1.3725281 -0.1339925
[3,] 0.1181854 0.8226650
[4,] -0.1308349 0.1545395
[5,] -0.2286347 1.6144183
[6,] 1.3650015 0.5099386Visualize loadings
factor.plot(faPC, cut=0.5)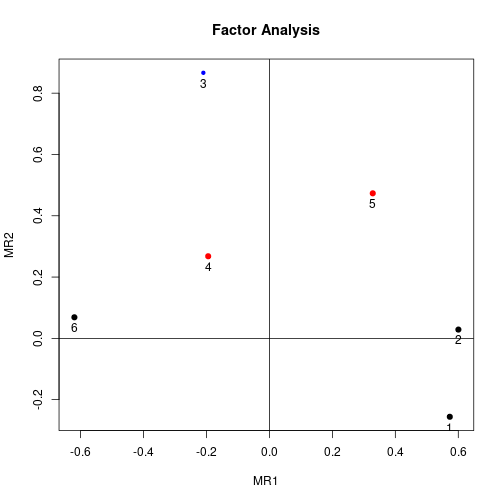
fa.diagram(faPC)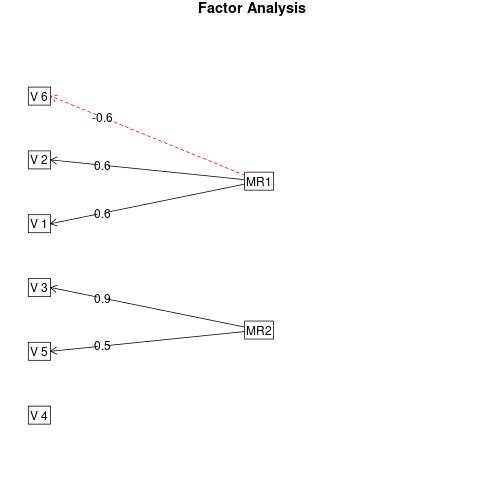
Determine number of factors
Parallel analysis and a “very simple structure” analysis provide help in selecting the number of factors. Again, package psych has the required functions. vss() takes the polychoric correlation matrix as an argument.
fa.parallel(X) # parallel analysis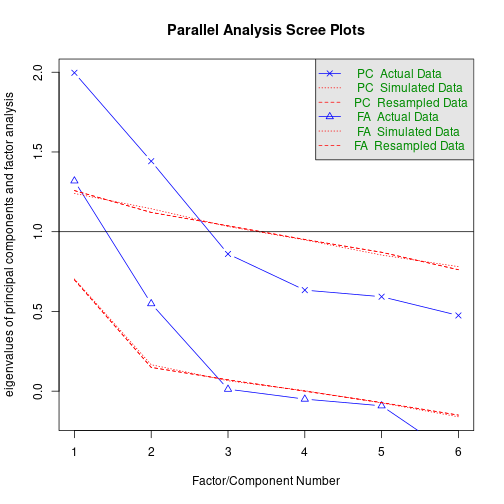
Parallel analysis suggests that the number of factors = 2 and the number of components = 2 vss(X, n.obs=N, rotate="varimax") # very simple structure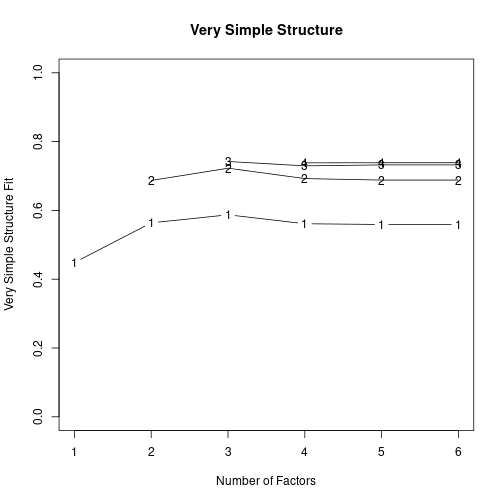
Very Simple Structure
Call: vss(x = X, rotate = "varimax", n.obs = N)
VSS complexity 1 achieves a maximimum of 0.59  with  3  factors
VSS complexity 2 achieves a maximimum of 0.72  with  3  factors

The Velicer MAP achieves a minimum of NA  with  1  factors
BIC achieves a minimum of  NA  with  2  factors
Sample Size adjusted BIC achieves a minimum of  NA  with  2  factors

Statistics by number of factors
  vss1 vss2  map dof   chisq    prob sqresid  fit RMSEA BIC SABIC complex
1 0.45 0.00 0.07   9 6.1e+01 8.4e-10     4.3 0.45  0.17  13  41.9     1.0
2 0.57 0.69 0.10   4 1.4e+00 8.4e-01     2.4 0.69  0.00 -20  -7.1     1.3
3 0.59 0.72 0.25   0 4.5e-02      NA     2.0 0.74    NA  NA    NA     1.3
4 0.57 0.72 0.45  -3 9.8e-11      NA     1.6 0.79    NA  NA    NA     1.4
5 0.52 0.67 1.00  -5 1.5e-12      NA     1.5 0.80    NA  NA    NA     1.6
6 0.53 0.67   NA  -6 0.0e+00      NA     1.5 0.81    NA  NA    NA     1.7
   eChisq    SRMR eCRMS eBIC
1 9.8e+01 1.3e-01 0.165   50
2 1.4e+00 1.5e-02 0.029  -20
3 4.3e-02 2.7e-03    NA   NA
4 1.1e-10 1.4e-07    NA   NA
5 1.8e-12 1.7e-08    NA   NA
6 8.2e-27 1.2e-15    NA   NA
Useful packages
For confirmatory factor analysis (CFA), see packages sem, OpenMx, and lavaan which implement structural equation models. More packages can be found in CRAN task view Psychometric Models.
Detach (automatically) loaded packages (if possible)
try(detach(package:psych))
try(detach(package:GPArotation))
try(detach(package:mvtnorm))
Get the article source from GitHub
R markdown - markdown - R code - all posts