Color, line type, and point shape in ggplot2 diagrams
Install required packages
wants <- c("ggplot2", "ggbeeswarm")
has   <- wants %in% rownames(installed.packages())
if(any(!has)) install.packages(wants[!has])
Simulate data
Data needs to be in long format such that color / line type / point shape can be controlled via variables.
Njk    <- 50
P      <- 4
Q      <- 2
IQ     <- rnorm(P*Q*Njk, mean=100, sd=15)
height <- rnorm(P*Q*Njk, mean=175, sd=7)
rating <- factor(sample(LETTERS[1:3], Njk*P*Q, replace=TRUE))
sex    <- factor(rep(c("f", "m"), times=P*Njk))
group  <- factor(rep(c("control", "placebo", "treatA", "treatB"), each=Q*Njk))
sgComb <- interaction(sex, group)
mood   <- round(rnorm(P*Q*Njk, mean=c(85, 80, 110, 90, 130, 100, 93, 121)[sgComb], sd=25))
myDf   <- data.frame(sex, group, sgComb, IQ, height, rating, mood)
Color
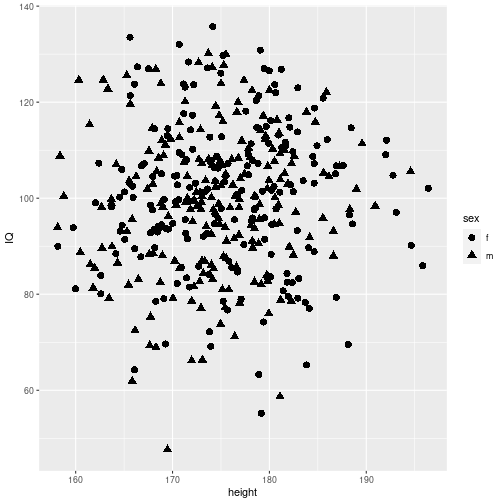
Point / line color
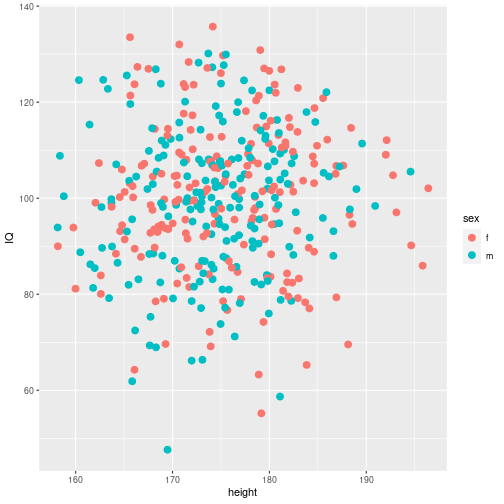
ggplot(myDf, aes(x=height, y=IQ, colour=sex:group)) +
        geom_hline(aes(yintercept=100), linetype=2) +
        geom_vline(aes(xintercept=180), linetype=2) +
        geom_point(size=3) +
        geom_smooth(method=lm, se=TRUE, size=1.2, fullrange=TRUE) +
        facet_grid(sex ~ group) +
        ggtitle("IQ ~ height split by sex and group") +
        theme(legend.position="none") +
        geom_text(aes(x=190, y=70, label=sgComb)) +
        annotate("text", x=165, y=130, label="annotation")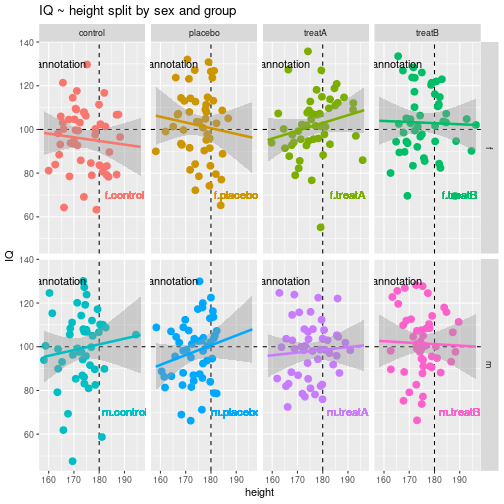
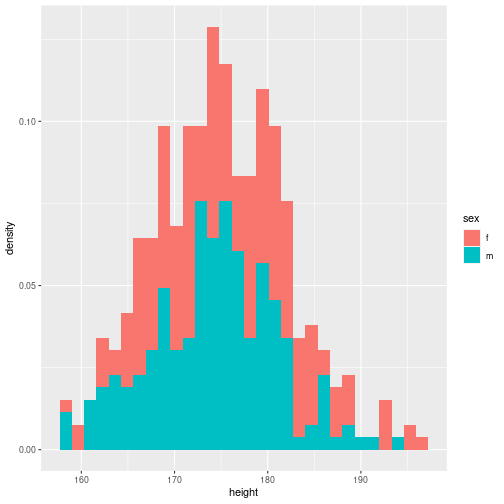
Fill color
library(ggbeeswarm)
ggplot(myDf, aes(x=sex, y=height, fill=sex)) +
    geom_boxplot(outlier.shape=NULL) +
    geom_beeswarm(alpha=0.5) +
    ggtitle("Height by sex") +
    theme(legend.position="none")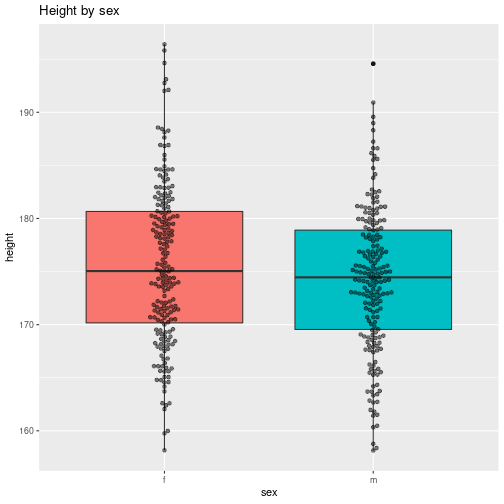
Point shape
Line type
  sex   group   mood
1   f control  87.04
2   m control  75.52
3   f placebo 110.06
4   m placebo  90.22
5   f  treatA 133.30
6   m  treatA 107.18
7   f  treatB  97.02
8   m  treatB 116.68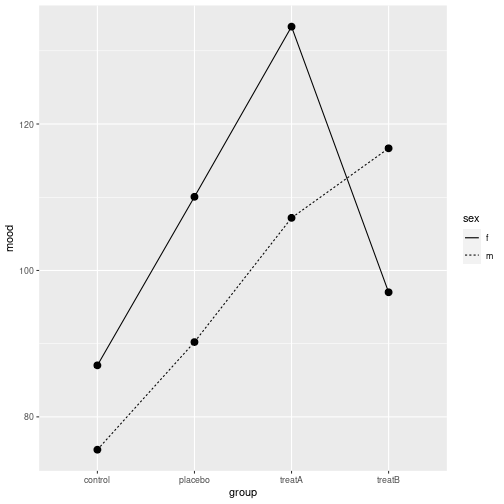
Further online resources
See Cookbook for R: ggplot2 diagrams for many detailed examples of ggplot2 diagrams.
Detach (automatically) loaded packages (if possible)
Get the article source from GitHub
R markdown - markdown - R code - all posts