Linear interpolation, polynomial smoothing, and splines
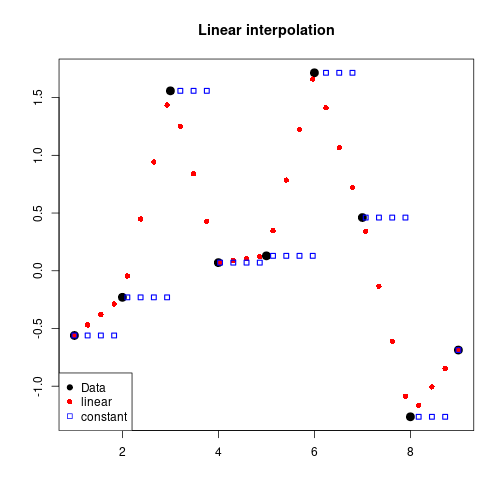
Linear interpolation
set.seed(123)
xOne     <- 1:9
yOne     <- rnorm(9)
ptsLin   <- approx(xOne, yOne, method="linear",   n=30)
ptsConst <- approx(xOne, yOne, method="constant", n=30)plot(xOne, yOne, xlab=NA, ylab=NA, pch=19, main="Linear interpolation", cex=1.5)
points(ptsLin, pch=16, col="red", lwd=1.5)
points(ptsConst, pch=22, col="blue", lwd=1.5)
legend(x="bottomleft", c("Data", "linear", "constant"), pch=c(19, 16, 22),
col=c("black", "red", "blue"), bg="white")
Polynomial smoothing
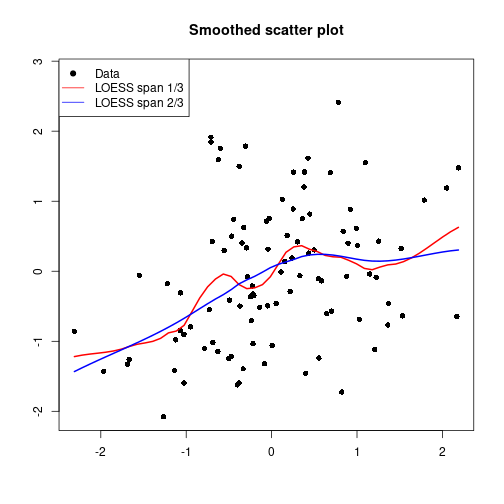
Local polynomial regression fitting
xTwo  <- rnorm(100)
yTwo  <- 0.4 * xTwo + rnorm(100, 0, 1)
ptsL1 <- loess.smooth(xTwo, yTwo, span=1/3)
ptsL2 <- loess.smooth(xTwo, yTwo, span=2/3)plot(xTwo, yTwo, xlab=NA, ylab=NA, pch=16, main="Smoothed scatter plot")
lines(ptsL1, lwd=2, col="red")
lines(ptsL2, lwd=2, col="blue")
legend(x="topleft", c("Data", "LOESS span 1/3", "LOESS span 2/3"),
pch=c(19, NA, NA), lty=c(NA, 1, 1),
col=c("black", "red", "blue"))
See supsmu() for Friedman’s SuperSmoother and smooth() for Tukey’s (running median) smoothing.
Splines
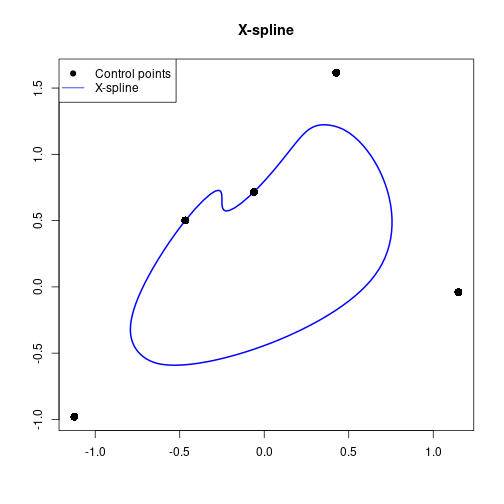
X-spline
ord   <- order(xTwo)
idx   <- seq(9, 89, by=20)
cPtsX <- xTwo[ord][idx]
cPtsY <- yTwo[ord][idx]
plot(cPtsX, cPtsY, xlab=NA, ylab=NA, main="X-spline", type="n")
xspline(cPtsX, cPtsY, c(1, -1, -1, 1, 1), border="blue",
        lwd=2, open=FALSE)
points(cPtsX, cPtsY, pch=16, cex=1.5)
legend(x="topleft", c("Control points", "X-spline"), pch=c(19, NA),
       lty=c(NA, 1), col=c("black", "blue"))
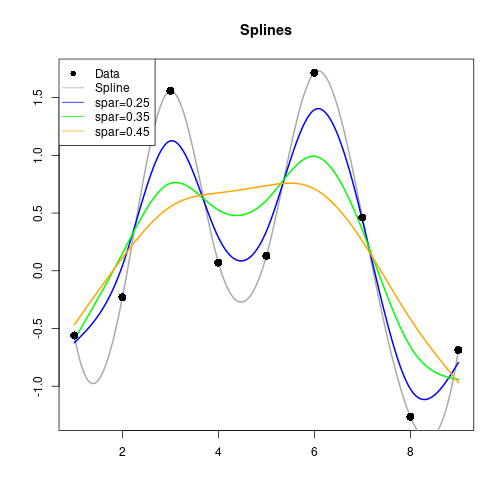
Cubic splines
ptsSpline <- spline(xOne, yOne, n=201)
smSpline1 <- smooth.spline(xOne, yOne, spar=0.25)
smSpline2 <- smooth.spline(xOne, yOne, spar=0.35)
smSpline3 <- smooth.spline(xOne, yOne, spar=0.45)
ptsX      <- seq(1, 9, length.out=201)
ptsSmSpl1 <- predict(smSpline1, ptsX)
ptsSmSpl2 <- predict(smSpline2, ptsX)
ptsSmSpl3 <- predict(smSpline3, ptsX)plot(xOne, yOne, xlab=NA, ylab=NA, main="Splines", type="n")
lines(ptsSpline, col="darkgray", lwd=2)
matlines(x=ptsX, y=cbind(ptsSmSpl1$y, ptsSmSpl2$y, ptsSmSpl3$y),
col=c("blue", "green", "orange"), lty=1, lwd=2)
points(xOne, yOne, pch=16, cex=1.5)
legend(x="topleft", c("Data", "Spline", "spar=0.25", "spar=0.35", "spar=0.45"),
pch=c(16, NA, NA, NA, NA), lty=c(NA, 1, 1, 1, 1),
col=c("black", "darkgray", "blue", "green", "orange"), bg="white")
Get the article source from GitHub
R markdown - markdown - R code - all posts