Multiple diagrams per window or device
Using layout()
Four equally sized cells
(mat1 <- matrix(1:4, 2, 2)) [,1] [,2]
[1,] 1 3
[2,] 2 4layout(mat1)
par(lwd=3, cex=2)
layout.show(4)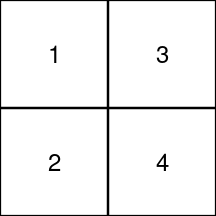
set.seed(123)
layout(mat1)
barplot(table(round(rnorm(100))), horiz=TRUE, main="Barplot")
boxplot(rt(100, 5), main="Boxplot")
stripchart(sample(1:20, 40, replace=TRUE), method="stack", main="Stripchart")
pie(table(sample(1:6, 20, replace=TRUE)), main="Piechart")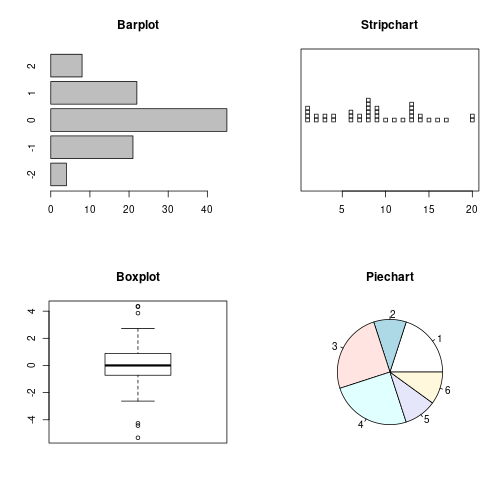
Four cells of different size
layout(mat1, widths=c(1, 2), heights=c(1, 2))
par(lwd=3, cex=2)
layout.show(4)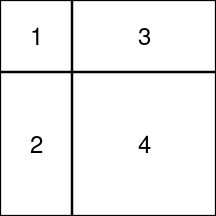
layout(mat1, widths=c(1, 2), heights=c(1, 2))
barplot(table(round(rnorm(100))), horiz=TRUE, main="Barplot")
boxplot(rt(100, 5), main="Boxplot")
stripchart(sample(1:20, 40, replace=TRUE), method="stack", main="Stripchart")
pie(table(sample(1:6, 20, replace=TRUE)), main="Piechart")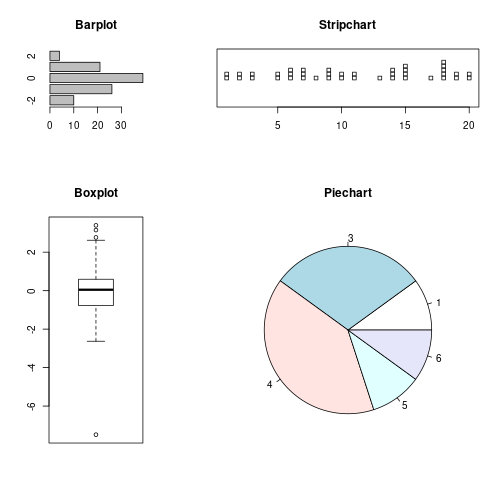
Combining and omitting cells
(mat2 <- matrix(c(1, 0, 1, 2), 2, 2)) [,1] [,2]
[1,] 1 1
[2,] 0 2layout(mat2)
stripchart(sample(1:20, 40, replace=TRUE), method="stack", main="Stripchart")
barplot(table(round(rnorm(100))), main="Barplot")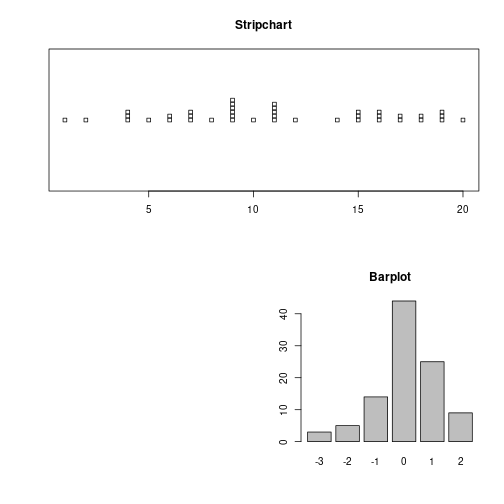
Using par(mfrow, mfcol)
par(mfrow=c(1, 2))
boxplot(rt(100, 5), xlab=NA, notch=TRUE, main="Boxplot")
plot(rnorm(10), pch=16, xlab=NA, ylab=NA, main="Barplot")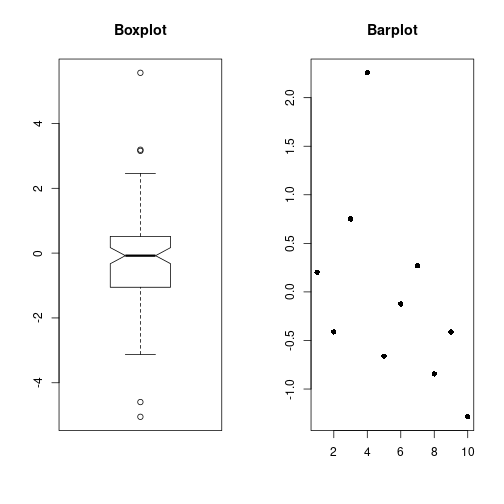
Using par(fig)
resBinom <- rbinom(1000, size=10, prob=0.3)
facBinom <- factor(resBinom, levels=0:10)
tabBinom <- table(facBinom)par(fig=c(0, 1, 0.10, 1), cex.lab=1.4)
plot(tabBinom, type="h", bty="n", xaxt="n", xlim=c(0, 10),
xlab=NA, ylab="Frequency",
main="Results from 1000*10 Bernoulli experiments (p=0.3)")
points(names(tabBinom), tabBinom, pch=16, col="red", cex=2)
par(fig=c(0, 1, 0, 0.35), bty="n", new=TRUE)
boxplot(resBinom, horizontal=TRUE, notch=TRUE, ylim=c(0, 10),
xlab="Number of successes", col="blue")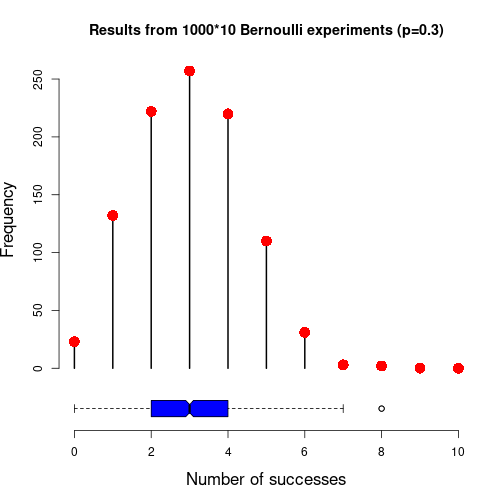
Using split.screen()
splitMat <- rbind(c(0,    0.5,  0,    0.5),
                  c(0.15, 0.85, 0.15, 0.85),
                  c(0.5,  1,    0.5,  1))
split.screen(splitMat)
[1] 1 2 3screen(1)
barplot(table(round(rnorm(100))), main="Barplot")
screen(2)
boxplot(sample(1:20, 100, replace=TRUE) ~ gl(4, 25, labels=LETTERS[1:4]),
col=rainbow(4), notch=TRUE, main="Boxplot")
screen(3)
plot(sample(1:20, 40, replace=TRUE), pch=20, xlab=NA, ylab=NA,
main="Scatter plot")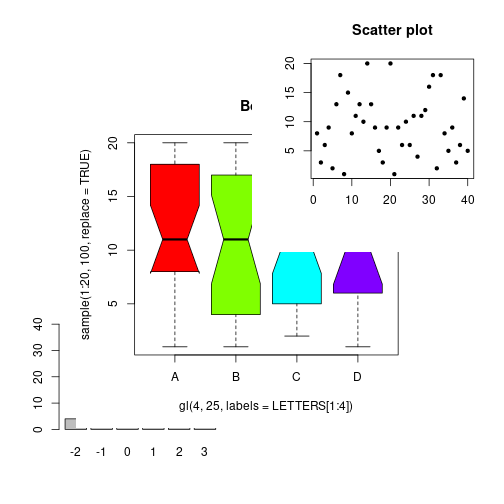
close.screen(all.screens=TRUE)Get the article source from GitHub
R markdown - markdown - R code - all posts