Analysis of covariance (ANCOVA)
TODO
- link to anovaSStypes
Install required packages
wants <- c("car", "effects", "multcomp")
has   <- wants %in% rownames(installed.packages())
if(any(!has)) install.packages(wants[!has])
Test the effects of group membership and of covariate
Visually assess the data
SSRIpre  <- c(18, 16, 16, 15, 14, 20, 14, 21, 25, 11)
SSRIpost <- c(12,  0, 10,  9,  0, 11,  2,  4, 15, 10)
PlacPre  <- c(18, 16, 15, 14, 20, 25, 11, 25, 11, 22)
PlacPost <- c(11,  4, 19, 15,  3, 14, 10, 16, 10, 20)
WLpre    <- c(15, 19, 10, 29, 24, 15,  9, 18, 22, 13)
WLpost   <- c(17, 25, 10, 22, 23, 10,  2, 10, 14,  7)
P <- 3
Nj <- rep(length(SSRIpre), times=P)
dfAnc <- data.frame(IV=factor(rep(1:P, Nj), labels=c("SSRI", "Placebo", "WL")),
DVpre=c(SSRIpre, PlacPre, WLpre),
DVpost=c(SSRIpost, PlacPost, WLpost))plot(DVpre ~ IV, data=dfAnc, main="Pre-scores per group")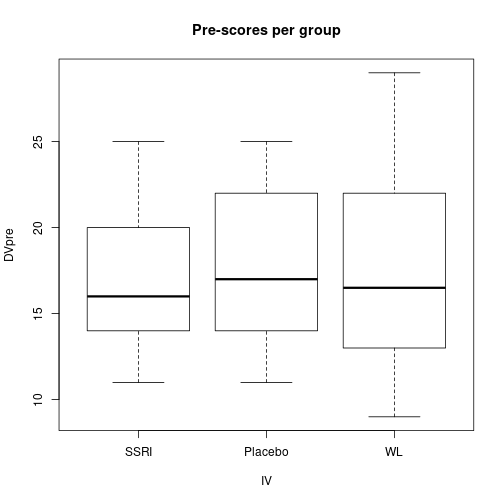
plot(DVpost ~ IV, data=dfAnc, main="Post-Scores per group")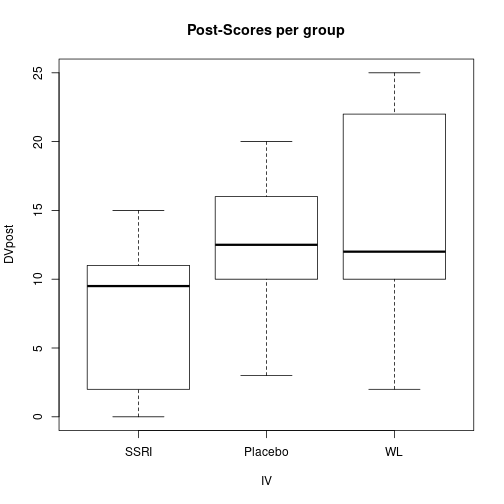
Type I sum of squares
fitFull <- lm(DVpost ~ IV + DVpre, data=dfAnc)
fitGrp  <- lm(DVpost ~ IV,         data=dfAnc)
fitRegr <- lm(DVpost ~ DVpre, data=dfAnc)anova(fitFull)Analysis of Variance Table
Response: DVpost
Df Sum Sq Mean Sq F value Pr(>F)
IV 2 240.47 120.23 4.1332 0.027629 *
DVpre 1 313.37 313.37 10.7723 0.002937 **
Residuals 26 756.33 29.09
---
Signif. codes: 0 '***' 0.001 '**' 0.01 '*' 0.05 '.' 0.1 ' ' 1Type II/III sum of squares
Since no interaction is present in the model, SS type II and III are equivalent here.
Using Anova() from package car
library(car)                       # for Anova()
fitFiii <- lm(DVpost ~ IV + DVpre,
              contrasts=list(IV=contr.sum), data=dfAnc)
Anova(fitFiii, type="III")
Anova Table (Type III tests)
Response: DVpost
Sum Sq Df F value Pr(>F)
(Intercept) 0.00 1 0.0001 0.991035
IV 217.15 2 3.7324 0.037584 *
DVpre 313.37 1 10.7723 0.002937 **
Residuals 756.33 26
---
Signif. codes: 0 '***' 0.001 '**' 0.01 '*' 0.05 '.' 0.1 ' ' 1Using model comparisons for SS type II
anova(fitRegr, fitFull)Analysis of Variance Table
Model 1: DVpost ~ DVpre
Model 2: DVpost ~ IV + DVpre
Res.Df RSS Df Sum of Sq F Pr(>F)
1 28 973.48
2 26 756.33 2 217.15 3.7324 0.03758 *
---
Signif. codes: 0 '***' 0.001 '**' 0.01 '*' 0.05 '.' 0.1 ' ' 1anova(fitGrp, fitFull)Analysis of Variance Table
Model 1: DVpost ~ IV
Model 2: DVpost ~ IV + DVpre
Res.Df RSS Df Sum of Sq F Pr(>F)
1 27 1069.70
2 26 756.33 1 313.37 10.772 0.002937 **
---
Signif. codes: 0 '***' 0.001 '**' 0.01 '*' 0.05 '.' 0.1 ' ' 1Test individual regression coefficients
(sumRes <- summary(fitFull))
Call:
lm(formula = DVpost ~ IV + DVpre, data = dfAnc)

Residuals:
     Min       1Q   Median       3Q      Max
-10.6842  -3.9615   0.6448   3.8773   9.9675

Coefficients:
            Estimate Std. Error t value Pr(>|t|)
(Intercept)  -3.6704     3.7525  -0.978  0.33703
IVPlacebo     4.4483     2.4160   1.841  0.07703 .
IVWL          6.4419     2.4133   2.669  0.01292 *
DVpre         0.6453     0.1966   3.282  0.00294 **
---
Signif. codes:  0 '***' 0.001 '**' 0.01 '*' 0.05 '.' 0.1 ' ' 1

Residual standard error: 5.393 on 26 degrees of freedom
Multiple R-squared:  0.4227,    Adjusted R-squared:  0.3561
F-statistic: 6.346 on 3 and 26 DF, p-value: 0.002252confint(fitFull) 2.5 % 97.5 %
(Intercept) -11.3836718 4.042941
IVPlacebo -0.5178144 9.414373
IVWL 1.4812101 11.402537
DVpre 0.2411673 1.049464Vsisualize ANCOVA coefficients
coeffs    <- coef(sumRes)
iCeptSSRI <- coeffs[1, 1]
iCeptPlac <- coeffs[2, 1] + iCeptSSRI
iCeptWL   <- coeffs[3, 1] + iCeptSSRI
slopeAll  <- coeffs[4, 1]
xLims <- c(0, max(dfAnc$DVpre))
yLims <- c(min(iCeptSSRI, iCeptPlac, iCeptWL), max(dfAnc$DVpost))
plot(DVpost ~ DVpre, data=dfAnc, xlim=xLims, ylim=yLims,
pch=rep(c(3, 17, 19), Nj), col=rep(c("red", "green", "blue"), Nj),
main="Data and group-wise regression lines")
legend(x="topleft", legend=levels(dfAnc$IV), pch=c(3, 17, 19),
col=c("red", "green", "blue"))
abline(iCeptSSRI, slopeAll, col="red")
abline(iCeptPlac, slopeAll, col="green")
abline(iCeptWL, slopeAll, col="blue")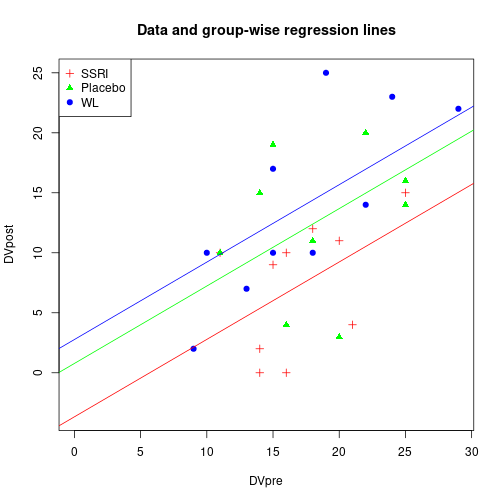
Effect size estimate
\(\hat{\omega}^{2}\) for the group effect
Using SS type II
anRes <- anova(fitRegr, fitFull)
dfGrp <- anRes[2, "Df"]
dfE   <- anRes[2, "Res.Df"]
MSgrp <- anRes[2, "Sum of Sq"] / dfGrp
MSE   <- anRes[2, "RSS"] / dfE
SST   <- sum(anova(fitFull)[ , "Sum Sq"])

(omegaSqHat <- dfGrp*(MSgrp - MSE) / (SST + MSE))
[1] 0.1187001Planned comparisons between groups
Adjusted group means
aovAncova <- aov(DVpost ~ IV + DVpre, data=dfAnc)
library(effects)                    # for effect()
YMjAdj <- effect("IV", aovAncova)
summary(YMjAdj)
 IV effect
IV
     SSRI   Placebo        WL
 7.536616 11.984895 13.978489

 Lower 95 Percent Confidence Limits
IV
     SSRI   Placebo        WL
 4.027629  8.476452 10.472608

 Upper 95 Percent Confidence Limits
IV
    SSRI  Placebo       WL
11.04560 15.49334 17.48437
Planned comparisons
cMat <- rbind("SSRI-Placebo"  = c(-1,  1, 0),
              "SSRI-WL"       = c(-1,  0, 1),
"SSRI-0.5(P+WL)"= c(-2, 1, 1))library(multcomp) # for glht()
aovAncova <- aov(DVpost ~ IV + DVpre, data=dfAnc)
summary(glht(aovAncova, linfct=mcp(IV=cMat), alternative="greater"),
test=adjusted("none"))
     Simultaneous Tests for General Linear Hypotheses

Multiple Comparisons of Means: User-defined Contrasts


Fit: aov(formula = DVpost ~ IV + DVpre, data = dfAnc)

Linear Hypotheses:
                    Estimate Std. Error t value  Pr(>t)
SSRI-Placebo <= 0      4.448      2.416   1.841 0.03852 *
SSRI-WL <= 0           6.442      2.413   2.669 0.00646 **
SSRI-0.5(P+WL) <= 0   10.890      4.183   2.603 0.00753 **
---
Signif. codes:  0 '***' 0.001 '**' 0.01 '*' 0.05 '.' 0.1 ' ' 1
(Adjusted p values reported -- none method)
Detach (automatically) loaded packages (if possible)
try(detach(package:effects))
try(detach(package:colorspace))
try(detach(package:lattice))
try(detach(package:grid))
try(detach(package:car))
try(detach(package:multcomp))
try(detach(package:survival))
try(detach(package:mvtnorm))
try(detach(package:splines))
try(detach(package:TH.data))
Get the article source from GitHub
R markdown - markdown - R code - all posts